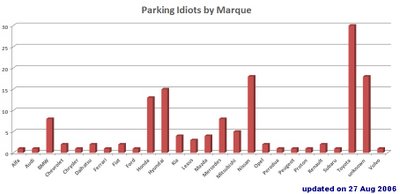
I've also got a couple of charts up. These two are for idiots charted by marque and by type. I'll update them every now and then. These two charts are not yet complete, as I have only started keeping track of the stats since the last hundred and fifty or so. Let me know if there are any other stats you would like to see.


11 comments:
hihi there.i think urr logo was great..nice too=))
I think the stats by car brands not very fair in the sense that there're a lot more jap cars in SG? So it's not fair to say that drivers of such cars are lousier parkers.. u get what i mean?
Beautiful logo! Keep up the good work, PI! :D
PI, how abt stats on repeat offenders..!! better still, show their plate numbers..
Nice logo...
for the stats... hmm... imho not sure if by marque or type is meaningful... perhaps by type of offence - double parking, bike-lot parking, inconsiderate parking at non parking lots, handicap lots, butt/head sticking out?
also i suspect Cisco or the enforcement company would like to know where are the "popular" car parks.
The stats by offence.. ok.. I have those as well. Shall post these up the next update.
As for the car on the logo being left-hand drive... oops! Will take note as I plan to improve on the logo - have received some suggestions from reader - thanks, you all!! Please keep them coming in!
Just a comment on the logo.
From viewing your log, its seems to me that the most prevalent iditoic parking is not the slanted parking, but the one that takes 2 lots.
So my suggestion for the logo would be to have the car positioned in the centre of 2 lots. You can make it more dramatic by making one of the 2 lots a handicapped one.
As for the stats. No surprise there since Toyota, Nissan and Hyundai are the top selling brands in Spore. But its still nice to get a feel.
the stats by marque should be corrected based on the car population by marque in order to be representative. otherwise, toyota drivers will always be the largest "contributors" to this blog
imho
a toyota wish driver
Pls produce stickers so we can stick on our cars.
Something like,:
"Watch Out! I am a Parking Idiot Warden"
I think the stats for the make of models not right considering the ratio for the no. of makes in singapore. Eg. toyota is of course has the most no. on the road, where as no. of BMW are less, naturally there are more offenders for toyota. So the charts not accurate.
by housing estates or roads... I am sure there are even specific carparks that are popular with idiots... like 232 AMK... or Lor 1, TP... or Ngee Ann Poly!
Parking Aunties and Incheks would probably appreciate such tip-offs.
Post a Comment